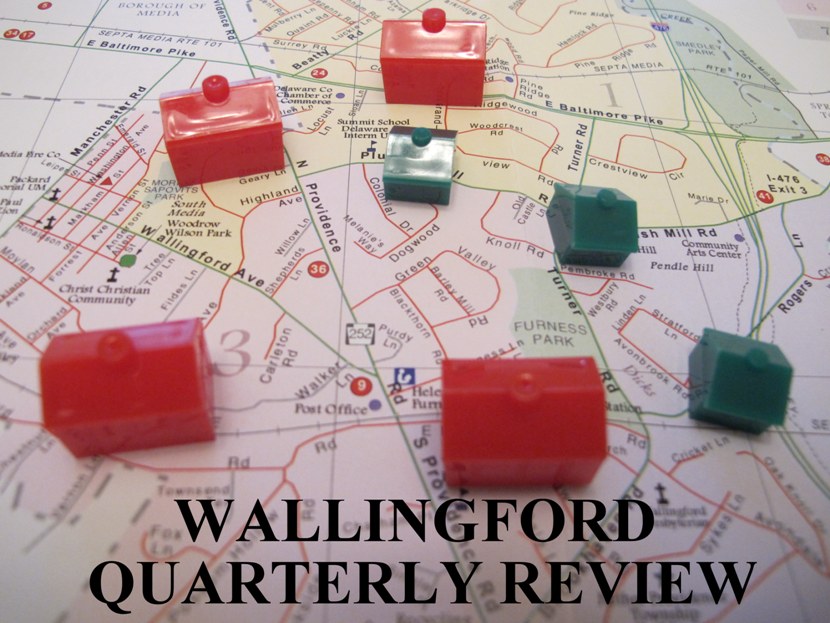
The 1st quarter of 2015 in Wallingford PA saw a total of 31 homes sold coming in 8 short of last year’s total of 39 representing a 20.5% decrease in units. The average sales price saw an increase to $267,675 from last year where it stood at $240,010, representing a 11.5% increase.
On average it took less time to sell during the months of January, February, and March, 18 days fewer then last year when Days On Market averaged 97 which represents a 15.6% decrease.
January and February each recorded 11 sales and 9 homes sold in March. The highest priced home sold in the 1st quarter was 605 Twyckenham Road that sold in March for $605,000.
| SALES | AVERAGE | DOM* | % ORIG LIST | % LAST LIST | |
|---|---|---|---|---|---|
| 2014 | 39 | $240,010 | 115 | 89.02% | 92.88% |
| 2015 | 31 | $267,675 | 97 | 89.28% | 96.14% |
| -20.5% | 11.5% | -15.6% | 0.26% | 3.26% |
1ST QUARTER 2015 – SALES BY PRICE RANGE
| PRICE RANGE | SALES |
|---|---|
| 0 To $100,000 | 5 |
| $100,000 To $200,000 | 6 |
| $200,000 To $300,000 | 7 |
| $300,000 To $400,000 | 8 |
| $400,000 To $500,000 | 3 |
| $500,000 To $600,000 | 1 |
| $600,000 To $700,000 | 1 |
| TOTAL | 31 |
| AVERAGE | MEDIAN | LOW | HIGH | DOM* |
|---|---|---|---|---|
| $304,195 | $312,000 | $77,299 | $605,000 | 104 |
| AVERAGE | MEDIAN | LOW | HIGH | DOM* |
|---|---|---|---|---|
| $63,667 | $46,500 | $46,500 | $98,000 | 37 |
| AVERAGE | MEDIAN | LOW | HIGH | DOM* |
|---|---|---|---|---|
| $204,275 | $204,275 | $189,500 | $219,050 | 86 |
| AVERAGE | MEDIAN | LOW | HIGH | DOM* |
|---|---|---|---|---|
| $93,500 | $93,500 | $93,500 | $93,500 | 100 |
*DOM = Days On Market
Wallingford PA Real Estate – Wallingford, PA 19086