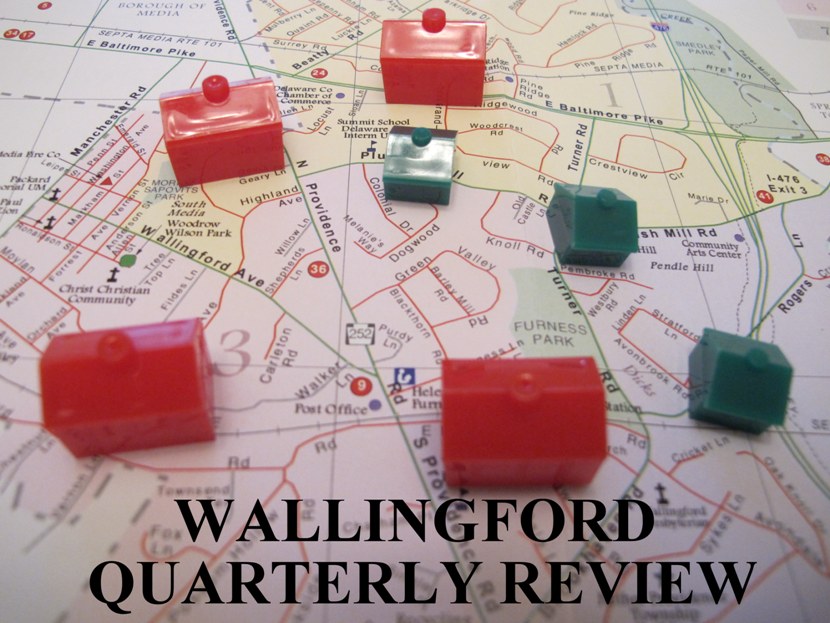
A total of 52 homes sold during the 4th quarter of 2016 in Wallingford PA. Sales volume increased substantially during the year’s final quarter – with 10 more homes sold compared to last year, but saw the average selling price decrease 6.0% to $271,111 compared to last year.
The 38 single family homes sold during the quarter saw the average selling price decrease versus last year’s 4th quarter by 2.0% going from $324,970 last year to $318,355 in 2016. Single homes averaged 79 days on the market during the quarter.
With the 4th quarter marking the end of the year the number of closed transaction for 2016 stands at 213 versus last year’s total of 214. The average selling price in Wallingford fell to $302,019 registering a 2.0% decrease from the $308,333 recorded last year.
There were 14 homes sold in October, 16 in November, and 22 in December.
The highest priced home sold in the 4th quarter was 915 Winding Lane that sold in December for $500,000.
| SALES | AVERAGE | DOM* | % ORIG LIST | % LAST LIST | |
|---|---|---|---|---|---|
| 2015 | 42 | $288,522 | 78 | 92.7% | 96.3% |
| 2016 | 52 | $271,111 | 79 | 91.4% | 95.4% |
| 23.8% | -6.0% | 1.2% | -1.3% | -0.9% |
4TH QUARTER 2016 – SALES BY PRICE RANGE
| PRICE RANGE | SALES |
|---|---|
| 0 To $100,000 | 5 |
| $100,000 To $200,000 | 12 |
| $200,000 To $300,000 | 12 |
| $300,000 To $400,000 | 15 |
| $400,000 To $500,000 | 7 |
| $500,000 To $600,000 | 1 |
| TOTAL | 52 |
| AVERAGE | MEDIAN | LOW | HIGH | DOM* |
|---|---|---|---|---|
| $318,355 | $338,750 | $110,000 | $500,000 | 79 |
| AVERAGE | MEDIAN | LOW | HIGH | DOM* |
|---|---|---|---|---|
| $181,133 | $162,000 | $144,000 | $299,900 | 82 |
| AVERAGE | MEDIAN | LOW | HIGH | DOM* |
|---|---|---|---|---|
| $85,913 | $90,950 | $65,750 | $96,000 | 121 |
| AVERAGE | MEDIAN | LOW | HIGH | DOM* |
|---|---|---|---|---|
| $142,450 | $142,400 | $65,000 | $220,000 | 31 |
*DOM = Days On Market
Wallingford PA Real Estate – Wallingford, PA 19086