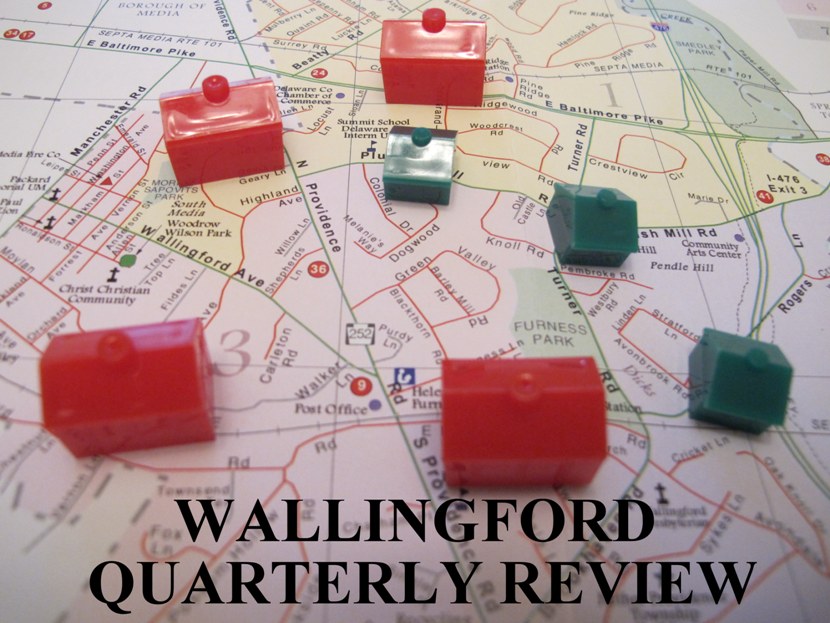
A total of 63 homes sold during the 3rd quarter of 2017 in Wallingford PA which betters last year’s tally by 10 homes. The average selling price increased 18.9% compared to last year coming in at $350,758.
The 46 single family homes sold during the quarter saw the average selling price increase by $45,958, rising 12.3% from $373,889 to $419,847. Single homes averaged 48 days on the market during the quarter.
At the 3/4 mark of 2017 the number of Wallingford homes sold is 8 greater than last year, with 169 closed transactions recorded through the end of September. The average selling price has seen an dramatic increase of 13.5% from $312,001 for the first 9 months of last year to an average of $354,022 for the July to September time frame this year.
There were 27 homes sold in July, 22 in August, and 14 in September.
The highest priced home sold in the 3rd quarter was 1314 Plush Mill Road that sold for $875,000.
| SALES | AVERAGE | DOM* | % ORIG LIST | % LAST LIST | |
|---|---|---|---|---|---|
| 2016 | 53 | $311,813 | 78 | 93.3% | 96.6% |
| 2017 | 63 | $350,758 | 51 | 96.1% | 97.7% |
| 18.9% | 12.5% | -34.6% | 2.8% | 1.1% |
3RD QUARTER 2017 – SALES BY PRICE RANGE
| PRICE RANGE | SALES |
|---|---|
| < $100,000 | 1 |
| $100,000 To $200,000 | 15 |
| $200,000 To $300,000 | 12 |
| $300,000 To $400,000 | 11 |
| $400,000 To $500,000 | 9 |
| $500,000 To $600,000 | 8 |
| $600,000 To $700,000 | 4 |
| $700,000 To $800,000 | 1 |
| $800,000 To $900,000 | 2 |
| TOTAL | 63 |
| AVERAGE | MEDIAN | LOW | HIGH | DOM* |
|---|---|---|---|---|
| $419,847 | $405,000 | $145,000 | $875,000 | 48 |
| AVERAGE | MEDIAN | LOW | HIGH | DOM* |
|---|---|---|---|---|
| $112,164 | $105,000 | $92000 | $184,300 | 51 |
| AVERAGE | MEDIAN | LOW | HIGH | DOM* |
|---|---|---|---|---|
| $281,500 | $284,500 | $182,000 | $375,000 | 69 |
| AVERAGE | MEDIAN | LOW | HIGH | DOM* |
|---|---|---|---|---|
| $212,500 | $212,500 | $200,000 | $225,000 | 82 |
*DOM = Days On Market
Wallingford PA Real Estate – Wallingford, PA 19086