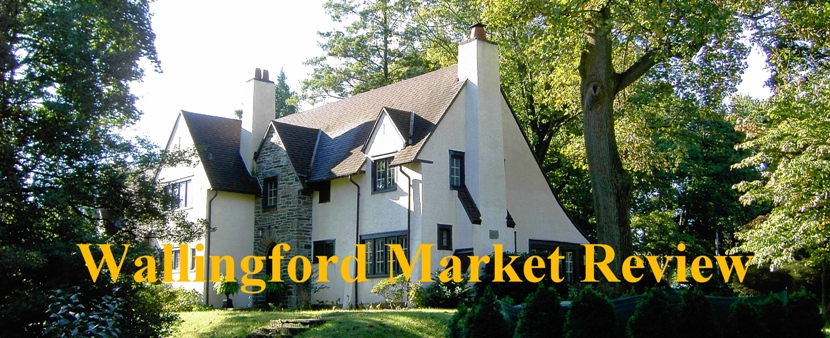
A weekly review of recently sold homes in Wallingford PA and current market statistics.
There are 43 homes listed for sale in Wallingford PA and Nether Providence Township on December 10, 2019 with an average asking price of $406,810.
The number of homes for sale plunged by nearly 10% annually in November at a time when low interest rates are increasing buyer demand, according to realtor.com®’s November 2019 Housing Trends report. The shortage of homes is accelerating: Inventories in November dropped 9.5% annually compared to 6.9% annually in October.
“As millennials—the largest cohort of buyers in U.S. history—embrace homeownership and take advantage of this year’s unexpectedly low mortgage rates, demand is outstripping supply, causing inventory to vanish,” says George Ratiu, realtor.com®’s chief economist. “The housing shortage is felt acutely at the entry-level of the market, where most millennials are looking to break into the market for their first home.” Further, Ratiu says that sellers appear to be reluctant to list their homes during the colder months when the market typically sees a seasonal slowdown.
Last month’s inventory declines equated to about a decrease of 131,000 listings nationwide compared to a year ago. The volume of new listings coming to the market fell by 7.7% compared to last year.
Affordable homes are hardest to find. The inventory of homes priced below $200,000 dropped 16.5% year-over-year in November. Homes priced between $200,000 to $750,000—considered mid-tier inventory—decreased 7.4% year-over-year, while high-end inventory above $1 million fell 1.7% year-over-year, realtor.com® reports.
View all Nether Providence Twp Homes For Sale
View all Homes Listed In The Last 7 Days
| AVERAGE | MEDIAN | LOW | HIGH | DOM* |
|---|---|---|---|---|
| $406,810 | $435,750 | $65,000 | $850,000 | 72 |
| AVERAGE | MEDIAN | LOW | HIGH | DOM* |
|---|---|---|---|---|
| $496,263 | $499,450 | $224,900 | $850,000 | 80 |
| AVERAGE | MEDIAN | LOW | HIGH | DOM* |
|---|---|---|---|---|
| $306,150 | $309,850 | $189,900 | $415,000 | 108 |
| AVERAGE | MEDIAN | LOW | HIGH | DOM* |
|---|---|---|---|---|
| $117,940 | $127,000 | $94,900 | $129,900 | 29 |
| AVERAGE | MEDIAN | LOW | HIGH | DOM* |
|---|---|---|---|---|
| $197,658 | $202,417 | $65,000 | $320,800 | 26 |
*DOM = Days On Market
5 Wallingford PA homes went under contract
5 new listings came onto the market
2 listings were withdrawn from the market
1 listing expired
31 homes are Under Contract at this time
3 Wallingford PA homes sold last week
| ADDRESS | TYPE | BED | BATH | PRICE | SETTLED | DOM* |
|---|---|---|---|---|---|---|
| 103 E Rose Valley Road | SNG | 3 | 2.0 | $252,500 | 12/02/19 | 4 |
| 412 Sheffield Drive | SNG | 3 | 1.1 | $392,500 | 12/06/19 | 10 |
| 16 Chestnut Parkway | SNG | 3 | 2.0 | $249,900 | 12/06/19 | 7 |
| AVERAGE | $298,300 | 7 |
No homes sold with a Seller Assist
Wallingford PA Real Estate – Wallingford, PA 19086


