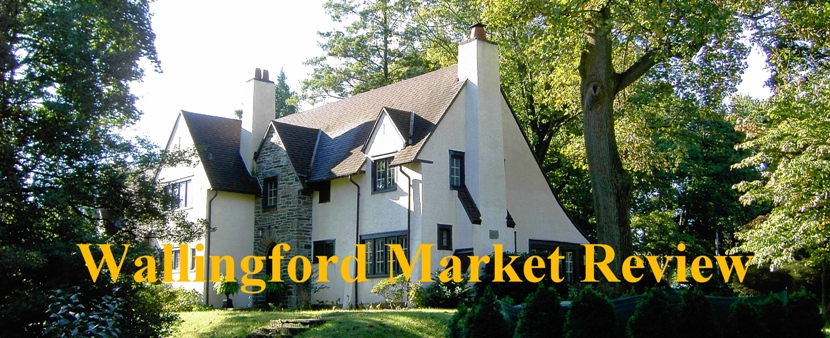
A weekly review of recently sold homes in Wallingford PA and current market statistics.
There are 34 homes listed for sale in Wallingford PA and Nether Providence Township on May 26, 2020 with an average asking price of $433,129.
Homeowners trying to sell during the pandemic will likely need some patience and a degree of expectation that the process could take longer. Homes are taking about an average of 15 days more to sell – or about 27% longer – than a year ago, according to Realtor.com®’s data reflecting the week ending May 16. This marks the largest increase in the number of days that homes have spent on the market since 2013.
Days on the market have been gradually increasing since the pandemic began. During the first two weeks of March, prior to the outbreak’s growth in the U.S., homes were selling four days faster than a year ago.
“Mid-May is normally the time of year when homes sell the fastest,” says Danielle Hale, realtor.com®’s chief economist. “Today’s median time on the market is more like what we usually see in late February or November.”
But stay-at-home orders and unemployment have prompted a slowdown in the market. The National Association of REALTORS® reported on Thursday that existing-home sales dropped 17.8% in April compared to March. Many economists view the sales slump as temporary, particularly given the sudden uptick in mortgage applications for home purchases.
But, while days on the market have increased, consumers shouldn’t assume it’s a buyer’s market now, housing analysts say. Home prices are staying firm. NAR reports that existing-home prices for all housing types jumped 7.4% in April compared to a year ago.
View all Nether Providence Twp Homes For Sale
View all Homes Listed In The Last 7 Days
| AVERAGE | MEDIAN | LOW | HIGH | DOM* |
|---|---|---|---|---|
| $433,129 | $396,450 | $125,000 | $1,044,900 | 61 |
| AVERAGE | MEDIAN | LOW | HIGH | DOM* |
|---|---|---|---|---|
| $518,439 | $535,000 | $223,000 | $1,044,900 | 70 |
| AVERAGE | MEDIAN | LOW | HIGH | DOM* |
|---|---|---|---|---|
| $309,580 | $319,000 | $229,900 | $389,000 | 34 |
| AVERAGE | MEDIAN | LOW | HIGH | DOM* |
|---|---|---|---|---|
| $134,800 | $129,900 | $125,000 | $149,500 | 49 |
| AVERAGE | MEDIAN | LOW | HIGH | DOM* |
|---|---|---|---|---|
| $283,333 | $290,000 | $245,000 | $315,000 | 46 |
*DOM = Days On Market
5 Wallingford PA home went under contract
3 new listings came onto the market
0 listings were withdrawn from the market
2 listings were temporarily taken off the market
0 listings expired
21 homes are Under Contract at this time
No Wallingford PA homes sold last week
| ADDRESS | TYPE | BED | BATH | PRICE | SETTLED | DOM* |
|---|---|---|---|---|---|---|
| – No Homes Sold – | – | – | – | – | – | – |
| AVERAGE | – | – |
Wallingford PA Real Estate – Wallingford, PA 19086


